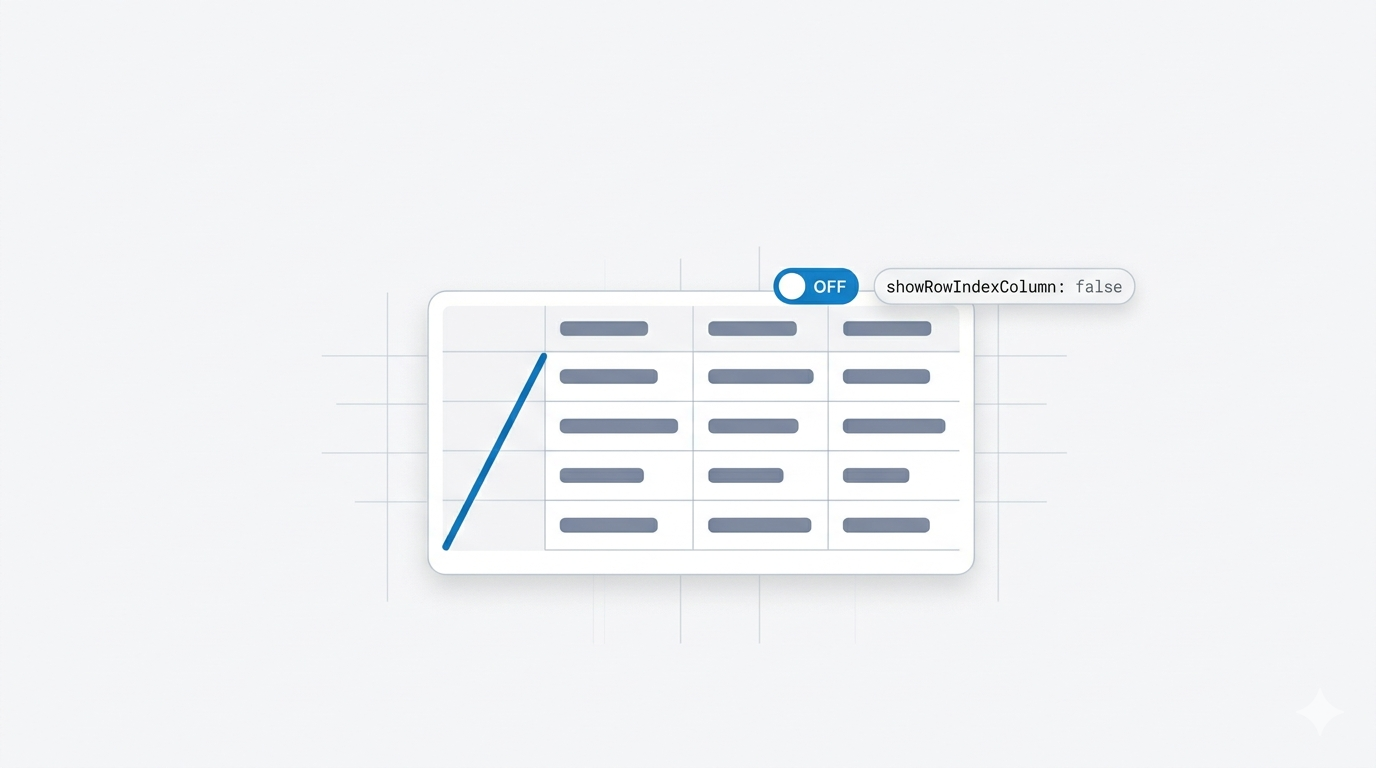
The problem: that pesky 1, 2, 3 column
If you've built a values table or compare table in a CRM Analytics dashboard, you've probably noticed an extra column sitting on the far left — a plain serial number that counts every row: 1, 2, 3, 4…
That's the row index column. CRM Analytics adds it by default to every table widget. It's handy when you need a running count, but most of the time it just clutters the table, confuses business users, and looks unprofessional in a polished dashboard.
The good news: hiding it takes about thirty seconds and a single line of JSON. No data changes, no rebuild, no SAQL. This guide walks you through exactly how to do it — and how to bring the column back if you ever need it again.
📸 Screenshot suggestion: drop in a "before" image here showing the table with the 1, 2, 3 row index column highlighted.
The setting that controls it: showRowIndexColumn
Every table widget in CRM Analytics stores its appearance settings inside a parameters block in the dashboard JSON. One of those settings is:
"showRowIndexColumn": true
It's a simple boolean (true/false) switch:
"showRowIndexColumn": true→ the serial number column is visible (this is the default)"showRowIndexColumn": false→ the serial number column is hidden
So the entire trick is flippingtruetofalse. Here's where it sits inside the widget's fullparametersblock so you know what you're looking for:
"parameters": {
  "columns": [],
  "showActionMenu": true,
  "showRowIndexColumn": false,
  "totals": true,
  "mode": "variable"
},
"type": "table"
You don't need to touch anything else — just the one line.
Method 1: Edit the widget JSON with the Advanced Editor (recommended)
This is the cleanest approach because you're working only on the table you care about, with zero risk of breaking anything else on the dashboard.
Step 1 — Open the dashboard in edit mode
From Analytics Studio, open your dashboard and click Edit (the pencil icon) in the top-right corner to enter the dashboard designer.
📸 Screenshot suggestion: the dashboard with the Edit button highlighted.
Step 2 — Select the table widget
Click once on the table that's showing the row index column. A blue border appears around it, and the property panel opens on the right-hand side of the screen.
📸 Screenshot suggestion: the table selected with its right-side property panel visible.
Step 3 — Open the Advanced Editor
In the right property panel, scroll down and click Advanced Editor. This opens the raw JSON that powers your selected widget — only this widget, nothing else.
📸 Screenshot suggestion: the property panel with the "Advanced Editor" link circled.
Step 4 — Find showRowIndexColumn and set it to false
Inside the JSON, locate the parameters section and find:
"showRowIndexColumn": true
Change true to false:
"showRowIndexColumn": false
💡 Tip: If you don't see showRowIndexColumn listed at all, that's fine — it simply means the widget is using the default (true). Just add the line yourself anywhere inside the parameters block, like this: "showRowIndexColumn": false, (mind the comma so the JSON stays valid).
📸 Screenshot suggestion: the JSON editor with the changed line highlighted.
Step 5 — Apply the change
Click Done (or Save, depending on your release) inside the Advanced Editor to close it and apply the change. You'll immediately see the row index column vanish from the table preview.
Step 6 — Save the dashboard
This is the step people forget. Click Save in the top-right of the dashboard designer to make the change permanent. If you want to keep the original version, use Save As and give it a new name instead.
📸 Screenshot suggestion: the "after" table with no row index column, plus the Save button.
✅ Done! The serial number column is gone, and your table looks clean.
Method 2: Edit the full dashboard JSON (for bulk changes)
If you have several tables to clean up at once, editing the entire dashboard JSON is faster than opening each widget one by one.
- With the dashboard open in edit mode, press Ctrl + E (Windows) or Cmd + E (Mac) to open the full dashboard JSON editor.
- Use Ctrl + F / Cmd + F to search for
showRowIndexColumn. - Change each
truetofalsefor every table you want to clean up. - Click Done to close the JSON editor.
- Click Save to save the dashboard.
⚠️ Caution: The dashboard JSON controls your entire dashboard. A misplaced comma or bracket can break it. Always make a copy with Save As before doing large edits, so you have a fallback.
How to show the row index column again
Changed your mind, or building a table where a running count is actually useful? Bringing the column back is just as easy — you reverse the switch.
- Open the dashboard in edit mode.
- Select the table widget and open the Advanced Editor (or open the full dashboard JSON with Cmd/Ctrl + E).
- Find the line and set it to
true:
"showRowIndexColumn": true
- Click Done, then Save the dashboard.
The 1, 2, 3 serial number column reappears on the left of your table.
Quick recap
| Goal | Set this value | Where |
|---|---|---|
| Hide the serial number column | "showRowIndexColumn": false |
Table widget parameters |
| Show the serial number column | "showRowIndexColumn": true |
Table widget parameters |
The two-step rule to remember every time: save the widget editor first, then save the dashboard. Skip the second save and your change won't stick.
Frequently asked questions
Where exactly is showRowIndexColumn in the JSON?
It lives inside the parameters block of your table widget, right next to settings like columns, totals, and showActionMenu. You reach it through the Advanced Editor on a selected table, or in the full dashboard JSON.
I don't see the property in my widget JSON — is something wrong?
No. If the line isn't there, the widget is using the default value (true). Just add "showRowIndexColumn": false, inside the parameters block yourself.
Does hiding the column change or delete any data?
Not at all. This is purely a display setting. Your underlying dataset, query, and step are untouched — you're only choosing whether the count column is visible.
Does this work for both values tables and compare tables?
Yes. Both table widget types support showRowIndexColumn, and the steps are identical.
My change disappeared after I refreshed — why?
You almost certainly closed the editor but didn't click Save on the dashboard itself. The widget editor and the dashboard have separate save actions.
Wrapping up
Hiding the row index column in CRM Analytics is one of those tiny tweaks that makes a dashboard look instantly more professional. It comes down to a single JSON property — showRowIndexColumn — flipped to false, saved on the widget, and saved again on the dashboard. Bring it back any time by switching it to true.
Bookmark this one. The next time a stakeholder asks, "What's that random 1, 2, 3 column doing in my report?" — you'll have it cleaned up before they finish the sentence.
Found this helpful? Share it with your Salesforce admin and developer friends, and explore more CRM Analytics tips on the blog. 🙏
— Namaste Salesforce